Uniting the People and Technology That
Move The World
Improving Logistics and Supply Chain Productivity, Performance, and Security
By combining innovative technology, powerful trade intelligence and the reach of our network, we deliver the industry’s most complete offering of cloud-based logistics and supply chain management solutions.
B2B Connectivity & EDI Messaging
Digitally connect and collaborate more efficiently with trading partners
Routing, Mobile & Telematics
Improve fleet productivity with integrated planning, dispatch, mobile, and telematics
Customs & Regulatory Compliance
Manage security, customs, and other agency filings to streamline cross-border trade
Broker & Forwarder Enterprise Systems
Digitize and optimize shipment management, customs compliance, and accounting
Ecommerce Shipping & Fulfillment Solutions
Improve and scale ecommerce warehouse, pick, pack, ship, and other logistics operations
Transportation Management
View, optimize, and manage transportation operations across modes
Global Trade Intelligence
Access global trade and restricted party data to maximize margins and vet trading partners
Want to find out more?
Descartes’ Solutions are Powered by Our Logistics Technology Platform
Descartes’ Logistics Technology Platform digitally combines the world’s most expansive logistics network with the industry’s broadest array of logistics management applications and most comprehensive offering of global trade related intelligence. It helps get inventory, information, assets and people where they’re needed, when they’re needed.
Descartes Insights
Thought leadership and customer success stories highlighting the strategies, tactics, technologies and best practices that will transform your organization’s performance.

Retailers: Sustainability is Not a Challenge. It’s an Opportunity.
The environment is becoming an increasingly important issue to consumers. So, what are retailers doing to address sustainability? Descartes commissioned a study of over 8,000 consumers across nine European countries, Canada and the United States to provide retailers and logistics organizations with critical insights into the importance of sustainability in consumer purchase and delivery decisions and how perspectives vary by age and geography.
Proven Customer Success Stories

Blue Sky
Blue Sky Distribution is using Descartes for fulfillment for wholesale & ecommerce customers
Fairmont Tire & Rubber
Learn how Fairmont Tire & Rubber is increasing distribution efficiency and delivery capacity with Descartes’ last mile delivery solution

Connect with Us
Follow Us
Exceeding Customer Expectations

Brav Norway (Swix)
Brav Norway (Swix) is accelerating bonded warehouse processes using Descartes technology
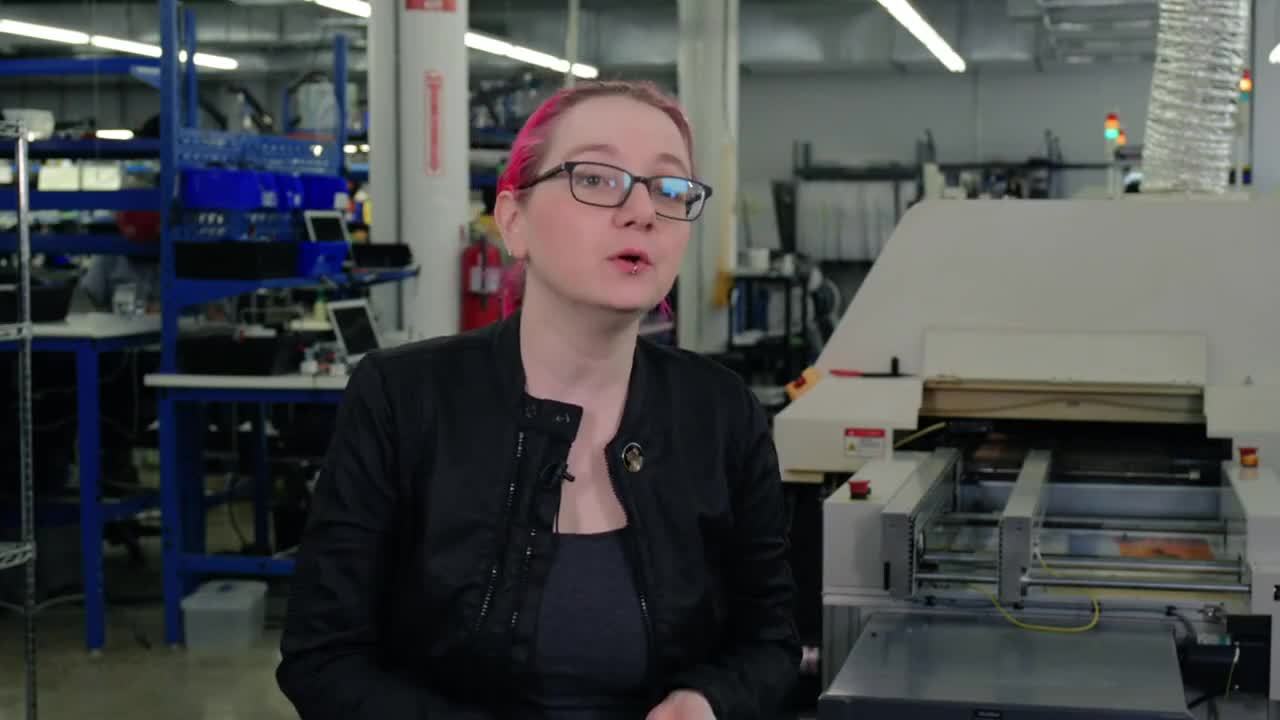
Adafruit Industries
Discover how Adafruit Industries is simplifying denied party screening with Descartes

GHY
Learn how GHY is streamlining cross-border customs clearance with Descartes
Featured News & Resources


